Every iOS developer has been there: hunting down a mysterious memory leak at 2 AM, trying to figure out why the network request failed, or watching your app’s FPS tank without knowing why. DebugSwift consolidates all your debugging needs into one toolkit that lives right in your app during development.
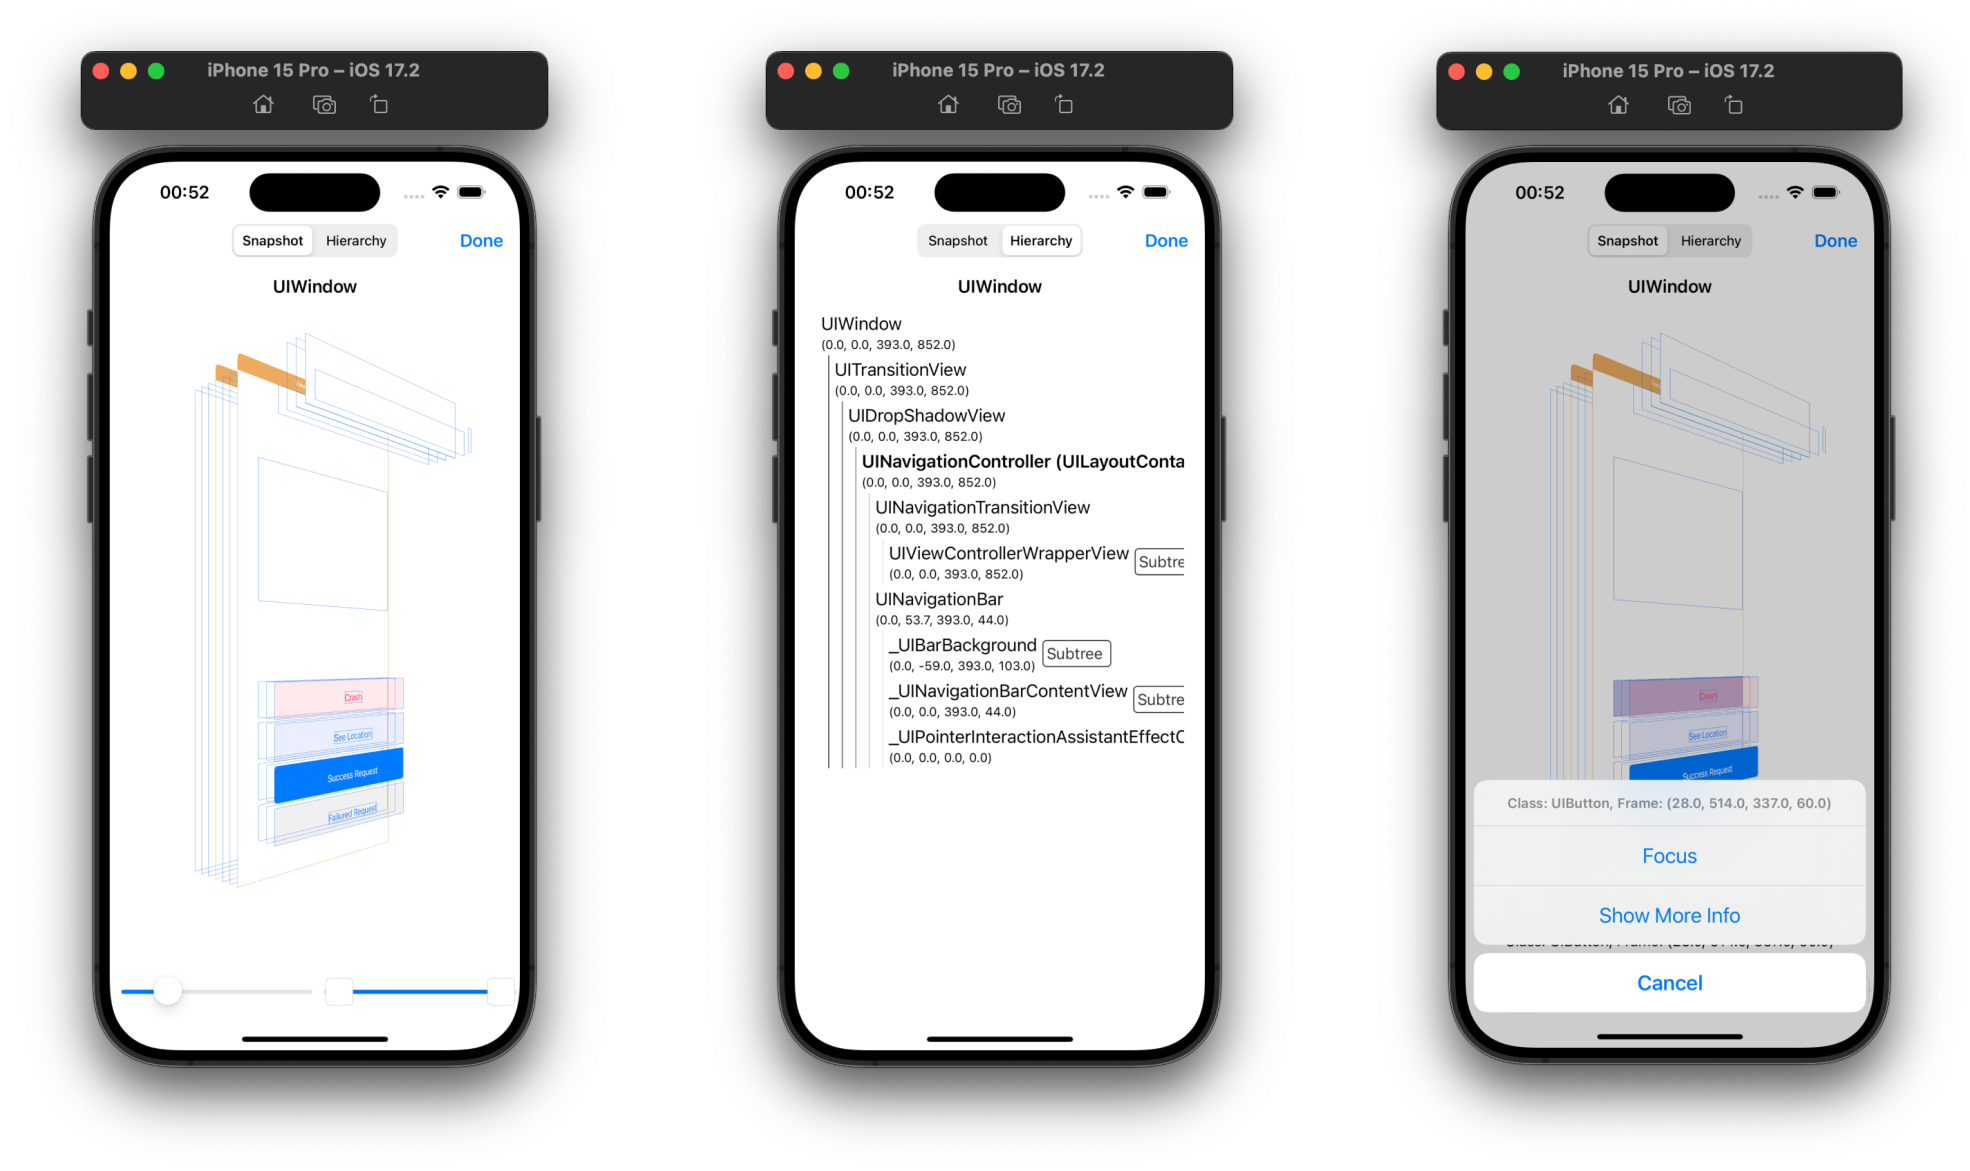
This isn’t just another logging library. DebugSwift automatically detects memory leaks in ViewControllers, intercepts and displays all HTTP/WebSocket traffic with JSON formatting, monitors CPU/memory/FPS in real-time, and even handles encrypted API responses with AES decryption. The network inspector alone saves hours of switching between Charles Proxy and your simulator, while the performance metrics give you instant feedback on optimization attempts.
With 1,600+ stars and Swift 6.0 support, it’s clearly resonating with developers tired of juggling multiple debugging tools. Setup is literally two lines of code via Swift Package Manager, and it automatically strips out in release builds. Whether you’re debugging a networking issue or hunting performance bottlenecks, DebugSwift turns your phone into a debugging powerhouse.
⭐ Stars: 1609
💻 Language: Swift
🔗 Repository: DebugSwift/DebugSwift